
- The population How many people are there in the world?
- What are the main demographic indicators?
- How is the population classified?
- What is a population pyramid?
- What are migratory movements?
- The population in Europe
The population How many people are there in the world?
When we talk about population , we mean the set of people who live in a specific place and in a specific period of time . With regard to the first of these elements, it is necessary to talk about the inhabitants of a municipality, county, province, region, country, continent or world, among others. Whereas if we refer to the second, we can establish the time frame we consider appropriate, although the most common is to use the last year. In short, space, time and number of people are the three main elements with which demography works , the science in charge of studying the population . However, this task can be done from multiple perspectives, among which we will highlight its evolution, characteristics and structure .

What are the main demographic indicators?
Demographic indicators are a set of data that allow us to study the population from a numerical perspective, providing relevant information about its historical evolution, the structure and the predominant behaviors among the members of a human community at a given time. Here we will stop to explain the five most important – birth rate, mortality, fertility, infant mortality and natural growth- although we will make a final reference to migrations.
Birth rate
It refers to the number of people born in a given place over the course of a year. It is calculated from the following formula:
Gross birth rate (Tbn) = number of births in a year x 1000 / total population.
Mortality rate
It refers to the number of people who died in a given place during a year. It is calculated from the following formula:
Crude mortality rate (Tbm) = number of deaths in a year x 1000 / total population.
Natural growth
It is the difference between the number of births and the number of deaths:
- Vegetative growth (Cv) = number of births – number of deaths.
In addition, this data is fundamental to calculate the rate of vegetative growth:
Vegetative growth rate (Tcv) = number of births – number of deaths x 1000 / total population
Fertility rate
Calculate the number of children that, on average, a woman will have during her fertile period. Therefore, in addition to the following formula, a standard age is established for the beginning (14 years) and the end (49 years) of this stage of life:
Fertility rate (Tf) = number of births x 1000/women between 14 and 49 years.
Infant mortality rate
It refers to the number of children who died during the first year of life. It is calculated from the following formula:
Infant mortality rate (IMR) = number of deaths under one year x 1000 / number of live births in one year.
Fertility rateInfant mortality rate
However, the study of the population cannot be done apart from migratory movements, that is to say, emigrants and immigrants. The first of these terms refers to those who leave their place of origin, while the second has to do with the arrival at a new destination of residence. It is at this point that it makes sense to talk about the migration balance, a figure that is calculated by subtracting the number of emigrants from the number of immigrants . In addition, the relationship between this data and the vegetative growth allows us to find the total growth :
- Total growth = vegetative growth + migratory balance.
How and why is the world population growing?
The world population is currently increasing at a rate of 1% per year . This figure refers only to natural or vegetative growth , since it makes no sense to take migrations into account when we talk about the inhabitants of the planet. However, if we wanted to know what is the demographic increase of a locality, a region, a country…, we should also take into account population movements.
Since 2000, Europe’s population has grown by less than 5%, while South America and Asia have grown by over 20%. However, the most surprising figure is from the African continent, where growth is over 60%. Based on these data, it is necessary to consider why the population increases more in some places than in others ; or, rather, how is it explained that in the most developed countries the increase in population is much lower than in the least developed countries.
If you’ve been paying attention throughout this resource, you’ve probably already guessed that this has to do with the demographic transition . Not surprisingly, while the developed world has long settled into the modern demographic regime, there are many other territories that are in the midst of change. Thus, while in Europe the birth rate is slightly above 10, in less developed countries it is around 30‰. In addition, the mortality rate has fallen on average to 11‰, which is why it is gradually approaching the European rate, which is 9‰. In short, with a still high birth rate and a clear decline in mortality , the consequence is clear: there is a large increase in the population .
However, we cannot stay solely with the data, but we must consider what leads to certain demographic behaviors. In the specific case of less developed countries, this high birth rate is a consequence of the following factors:
- There is a large amount of young population, and this is a guarantee of population growth because they are of childbearing age.
- For cultural and religious reasons, the fertility rate is high, around four children per woman.
- The lack of legislation on child labor means that, from very early on, children become an economic benefit to the family unit instead of being an expense.
How is the population classified?
When classifying the population, the most relevant criteria for demography are those that affect age and sex . These make it possible to learn about the evolution of a human group, its most important dynamics and even to predict future situations.
According to their age , we organize the population into three groups:
- Youth: From 0 to 14 years.
- Adults: From 15 to 64 years.
- Elderly: Over 65 years old.
For its part, the classification by sex allows us to divide the population between men and women. Regarding this, it is important to take into account two realities that, although not common to all regions and countries, are fulfilled globally:
- The number of births of the male sex is greater than that of the female sex.
- Life expectancy is significantly higher in women than in men.
Taking into account the occupational structure – that is, their work activity -, we can classify the population into two large groups:
- Active population In this group are those people who, being of working age, have work or are looking for it. In the former we know them as the employed active population and in the latter as the unemployed active population.
- Inactive population. In this group there are those people who, being of working age, decide to dedicate themselves to other tasks. In other words, they don’t have a job and are looking for one. Students, early retirees and those who decide to stay at home doing household chores would stand out among them.
At the same time, the active population can be employed in any of the three economic sectors :
- primary: Includes activities related to agriculture, livestock, fishing, hunting and forestry.
- secondary: It is made up of those activities that transform raw materials into finished or semi-finished products; that is, we would be talking about industry and craftsmanship. However, this group also usually includes extractive mining work.
- tertiary: Refers, fundamentally, to services.
What is a population pyramid?
A population pyramid, as can be seen in the attached image, is a chart organized horizontally by sex and vertically by age . The latter are usually represented, from youngest to oldest, in five-year groups on a central axis, with men on the left and women on the right. At the same time, the horizontal bars show the population of each sex in this age group, and their length proportional to the number of people.
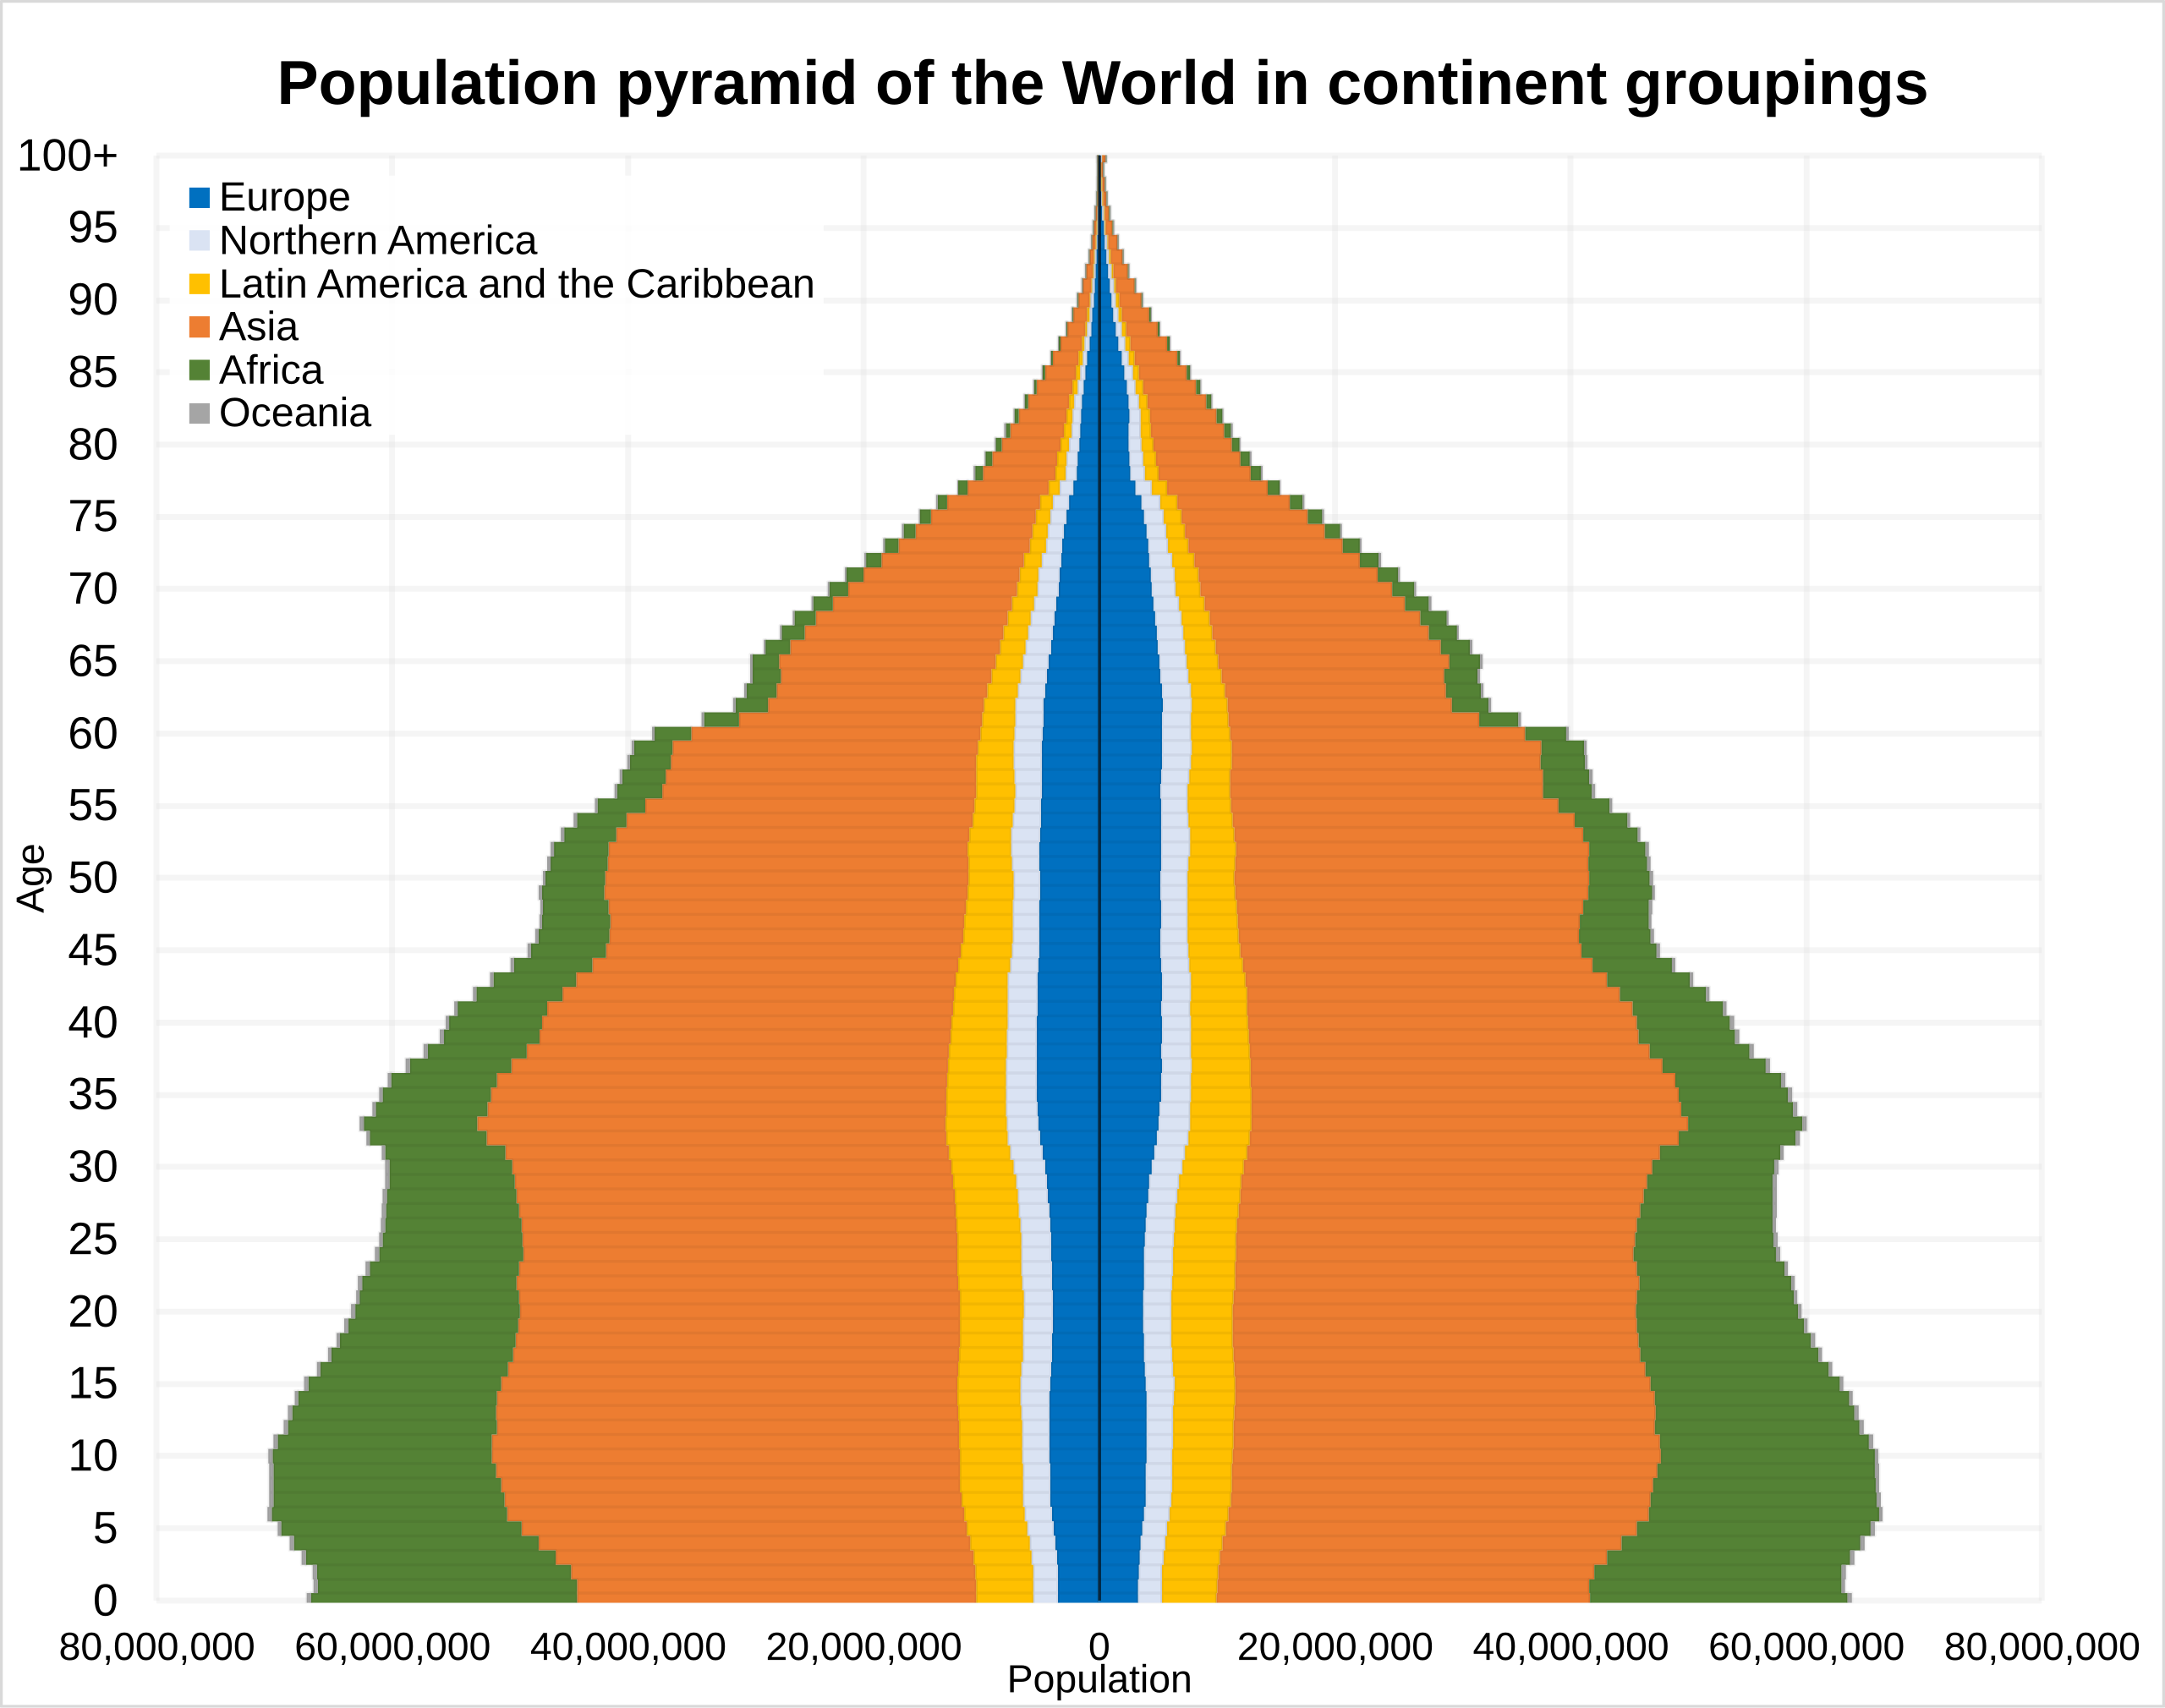
The organization of the population graphically through pyramids facilitates the following tasks when studying demography :
- Reflect the existence of imbalances between the sexes.
- Make evident the aging of the population.
- Discover the consequences of historical processes such as wars, famines or epidemics.
- Compare the population of different places.
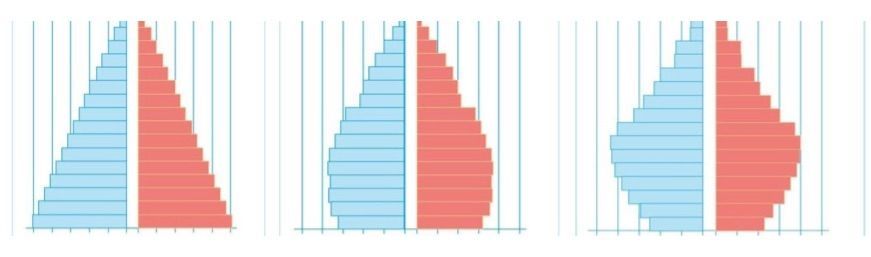
Taking into account the shape that the pyramid takes according to sex and age groups, we need to talk about three typologies :
- progressive It is the typical pyramid of less developed countries and is characterized by the abundance of the young population. In fact, it is wide at the base and, as age progresses, it narrows.
- stationary It is the most common pyramid in countries that are in the development phase , with the adult population being the predominant group. In fact, as a result of the decrease in the birth rate, the base has very similar numbers to the age groups located immediately above.
- Regressive It is the most common pyramid in developed countries , showing the consequences of a low birth rate and a high life expectancy. In short, its base is narrower than the top, and this leads to an aging population.
What are migratory movements?
We call migration the set of population movements that people make from their place of origin to a different one. At the same time, depending on whether these take place within the same country or between different states, we would speak of internal or external migration ; both can be of a temporary nature – that is, limited to a specific time – or indefinite.
The demographic indicator associated with migration is the migration balance , which relates the number of emigrants to immigrants:
- Migration balance = immigrants – emigrants.
Immigration refers to population movements from the perspective of destination , while the process by which people leave their place of origin is called emigration . Therefore, an immigrant is the person who arrives in a place and the emigrant is the person who leaves it.
Currently, most emigrants come from less developed countries , and their economic situation is the main cause of population movement. To this it must be added that these are the territories which, due to their high birth rate, are experiencing a greater natural population growth.
On the other hand, the main destination countries are the most developed , highlighting Europe, North America and some areas of Southeast Asia. In addition, the economy of the first two regions needs labor that, as a result of the low birth rate and the aging of the population , it is not possible to find among the natives.
Finally, it is important to bear in mind that these migratory flows have been favored in recent decades by advances in transport and communications . In this way, migrants have more facilities to move, while at the same time they have abundant information about their destinations.
Why do migrations occur?
The reasons that lead people to leave their place of origin to settle in a new one are diverse and change over time. They also depend a lot on the region, country or continent we are referring to and, in most cases, they do not obey a single cause, but are produced by a cluster of causes. Among these, we will highlight the following:
- economic: it is related to the search for better living conditions. In other words, people leave their place of origin because of the poverty situation where they live or because they have no opportunities to find a job, moving to other places where they can prosper.
- Social, they have to do with the attraction exerted by certain destinations, especially among the younger population. Migrations from the countryside to the city or to more dynamic regions with more cultural and leisure offers are causing the world’s population to cluster in large cities.
- natural disasters: phenomena such as earthquakes, droughts, floods, bad harvests, etc., lead people to leave their place of origin in search of greater security in new destinations.
- political: as a result of war conflicts or religious and ethnic persecutions.
Population movements have consequences , first of all, for the migrants themselves . People who leave their place of origin leave many aspects of their lives behind, as well as family and friends. To this must be added the uncertainty of what awaits him, which sometimes also means changing culture and language . Logically, all this set of negative consequences are assumed in order to improve working and living conditions by taking advantage of the new opportunities offered by the place of destination.
Migration also has consequences for the regions of origin and host. The first ones lose a certain amount of population , which, when they are usually of working age, means a loss of manpower. However, it is quite common for immigrants to send money to their relatives, thus increasing wealth in their place of origin . For their part, the regions that receive migrants benefit from the arrival of workers and a young population , which, usually, allows to alleviate the consequences of social aging.
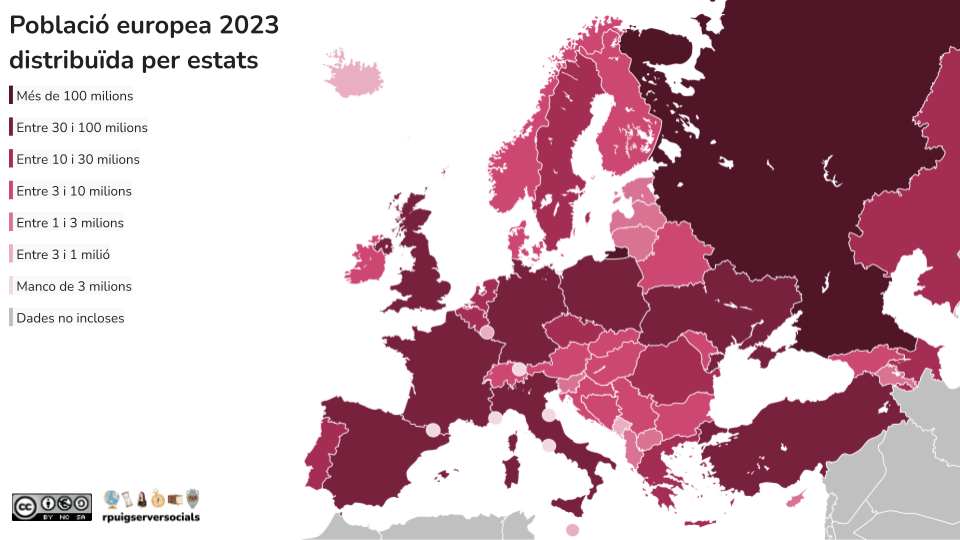
The population in Europe
Around the year 1900, Europe reached 400 million inhabitants, standing at 600 million at the beginning of the seventies of the 20th century and at 700 million at the end of this century. However, since then the European demographic trend has been towards stagnation and even population loss. In fact, according to UN estimates, the population of Europe will be less than 650 million inhabitants at the end of this century.
There are two causes that are leading to the stagnation of European population growth:
- low fertility: One of the causes is the reduction experienced by the fertility rate since 1960. In fact, in this decade the number of children per woman was slightly above 2.5, reducing to 1.7 in 1990 and 1.5 in 2020. According to United Nations estimates, this number will remain constant until in the middle of the current century, so the generational relief rate, which stands at 2.1, will not be reached.
- low birth rate and mortality: The birth rate, an indicator closely related to what has just been discussed, has been reduced from 10.5‰ in 2010 to 9.1‰ in 2020. This data is, in itself, very significant, but it acquires a greater value if we add that, currently, the mortality rate in Europe is above 11%. Ultimately, a birth rate two points lower than the death rate leads us to a clear conclusion: natural growth in Europe is negative.
In 2021, the life expectancy of European men was 77.8 years , while that of women was 83.3 years . In order to better contextualize these figures, we must bear in mind that the average for both sexes in Africa was 64 years and that, of the twenty countries with the longest life expectancy, thirteen were European .
Obviously, this is good news for Europe. However, if we relate it to the fall in fertility and birth rates , what leads us is a progressive aging of society . In fact, in 2021 those over 65 were already a fifth of the continent’s population.
The economic development of European countries, job opportunities, political stability and favorable living conditions have led to an increase in migratory flows towards the continent in recent decades. In addition, as a consequence of what has been explained above, Europe itself needs a young population and, above all, workers.
However, migrants do not only arrive for economic reasons, but European countries have also become the destination of many refugees. War conflicts and ethnic, political and religious persecution have brought thousands of people to Europe’s borders.
Finally, reference must be made to population movements within the continent itself , which have been facilitated by the free movement of people within the countries that make up the European Union.
References
Carlos González Martínez. Itinerario. La población. Geografía e Historia. 3.º ESOColección “Itinerarios didácticos”

Per publicar un comentari heu de iniciar sessió.